We’ve begun adding the first visualisation pieces to DBHub.io, so people can display charts from their data.
eg:
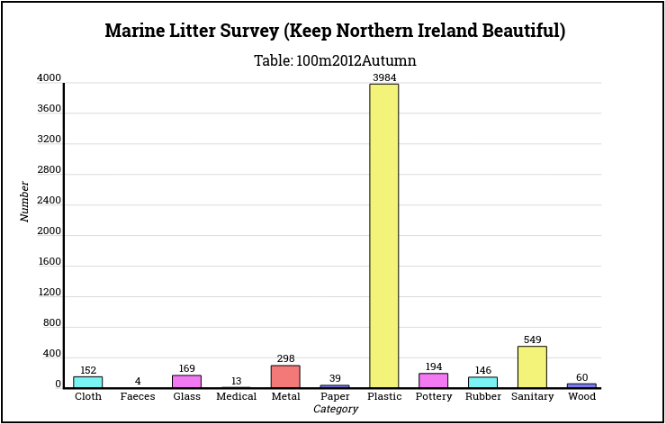
This is only the starting point (eg a simple vertical bar chart) while we experiment, to find a good workflow that’s easy for people to use + customise.
We’re aiming to add several more chart types to choose from, and there being a selection of easy-to-use predefined templates as well.
Advanced users will ideally be able to input their own SQL queries for generating the data points to visualise. That’s going to take some time however.
When it’s working well, this should for displaying useful visual “diffs” (aka comparisons) between different revisions of data. Super useful for all kinds of things, including the still-in-development “Merge Request” functionality.
Problem reports, feature requests, (etc) are welcome. 😄